•  
Crop a Rectangle
Map made online @mapgrafica.com
Resize tool info

Resize the design canvas, the map, or position the map on the canvas.

Crop tool info

Cut and resize parts of the map. Zoom-in.

Background tool info

Set background color, base Map, map color, shape color or pattern, change map projection.

Outlines tool info

Set outlines style - color, width and dash pattern.

Borders tool info

Set borders style - color, width and dash pattern.

Labels tool info

Set Labels style - font color, foreground, font size, style and font family.
Set size to 0 to hide labels.

Locations tool info

Add Point sets, click on the map to add points or use control bar to display more/less cities.
Style location markers using simple shapes or symbols.

Legend tool info

Enable legend design, set background, outline, size and position on the canvans.

Data labels tool info

Set Data Labels style - font color, foreground, font size, style and font family.

Data visualization tool info

Load data sets, choose Quantity or Quaility representation and then style the color scheme, symbols or charts.

Drawings tool info

Add SVG drawings - Shapes or Text, or add Images to the design.

Canvas & Map Size
Canvas Size
Resize & Reposition Map
Clip Labels
Crop
Crop & Zoom-in
Basic Style
Background Color
Background Image
Map Color
Base Map
Shapes
Borders
Labels
Codes
Shape Color
Shape Pattern
Projection Mercator
Borders
Quality
100
Stroke
Labels
Labels
Font
Text Highlight
Connector
Edit & Reposition
Legend
Legend Frame
Background Color
Stroke
Font
Legend Design
Data Labels
Labels
Font
Text Highlight
Connector
Edit & Reposition
Shapes & Images
  • Image
  • Horizontal Text
  • Horizontal Line
  • Diagonal Text
  • Straight Line
  • Curved Text
  • Vertical Line
  • Polyline
  • Rectangle
  • Circle
  • Polygon
  • Ellipse
  • Quadratic Bezier Curve
  • Circular Arc
  • Cubic Bezier Curve
  • Arc
Data Visualization
Data values
Load Data Values
Quantity Representation
Color Scheme
Qualitative Categories
Linear color gradient
Range
Label

Range
Label
Symbols to represent data
Symbol Multiplicity
Symbol Instance Size and Count
Size
1.0
Maxim
1
Charts to represent data
Comparison of Divisions
Charts Style
Size
100
Stroke
Font
Show Name
Show Value
Show %
Symbols Size Range
Smallest
1.0
Largest
1.0
Symbol Style
Stroke
Data Sets Coloring
Reposition
Reposition

Edit map style & data manualy - JSON format

Failed to reload map design from code!
Loading. Please wait.
Stroke
Fill
Text
Font
Image
Delete
Font
Background
Connector
Hide
Coordinates:
Click on Canvas to start drawing.
Double click when done.
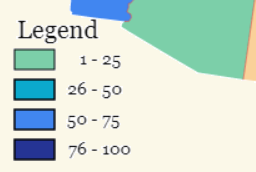
REDO
UNDO
 
RGB Alpha

Opacity
1.0
Font
Size
14px
Dash
?,?
Width
1.0
Line join
Choose a Map projection
Lambert Projection
A conic map projection
Mollweide Projection
A pseudocylindrical map projection bounded by an ellipse
Mercator Projection
A cylindrical map projection
Geographic Projection
A equidistant or equirectangular map projection
Create a new Map
Data values
Import from File
Load Multiple data sets
Multiple sets of data: Division ID, Set1 value, Set 2... value
(e.g. FL,42)
(e.g. TX,36,75,90,88) - Use numeric values
Single set of data: Division ID, value, label (optional)
(e.g. FL,42)
(e.g. NY,65000,$65,000)

Edit text or Copy & Paste tabular data from a file.

Entered data is not valid!
Location Points - Set
Import from File
Please use this format for each line:
Latitude, Longitude, Name [label - optional], Size [pixels - optional]
e.g. 40.76078,-111.89105,Salt Lake City,75
e.g. 40.76078,-111.89105,Salt Lake City
e.g. 40.76078,-111.89105,,75
e.g. 40.76078,-111.89105

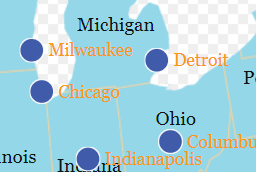
Add Points with coordinates - Edit text or Copy & Paste tabular data from a file.
Search for coordinates - Enter City names, e.g. Boston, New York, Chicago - then click "Search"

Entered data is not valid!

Choose a shape or image symbol

Shapes (Size, stroke and fill can be customized)
Images (Size can be customized)
Choose a stock SVG shape or image
Shapes
Images
Save image & Design code
How Save works
.png
.json