Shaded Area Color Maps
Color maps or Choropleth maps are used to provide an easy way to visualize how the measurement data or the statistical data varies across a geographic area, or administrative units.
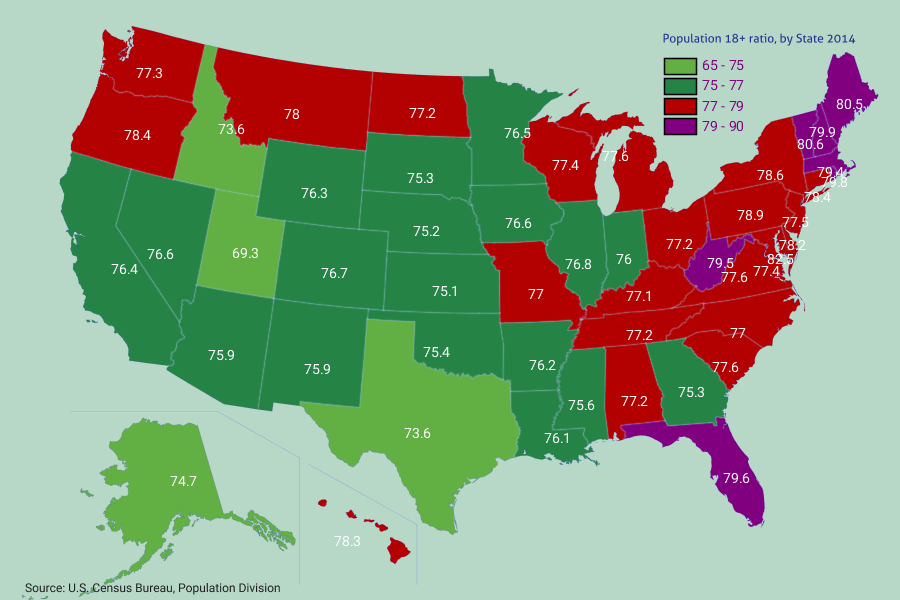
Qualitative color scheme uses distinctive colors to distinguish different categories in a data set.
Qualitative color scheme uses distinctive colors to distinguish different categories in a data set.
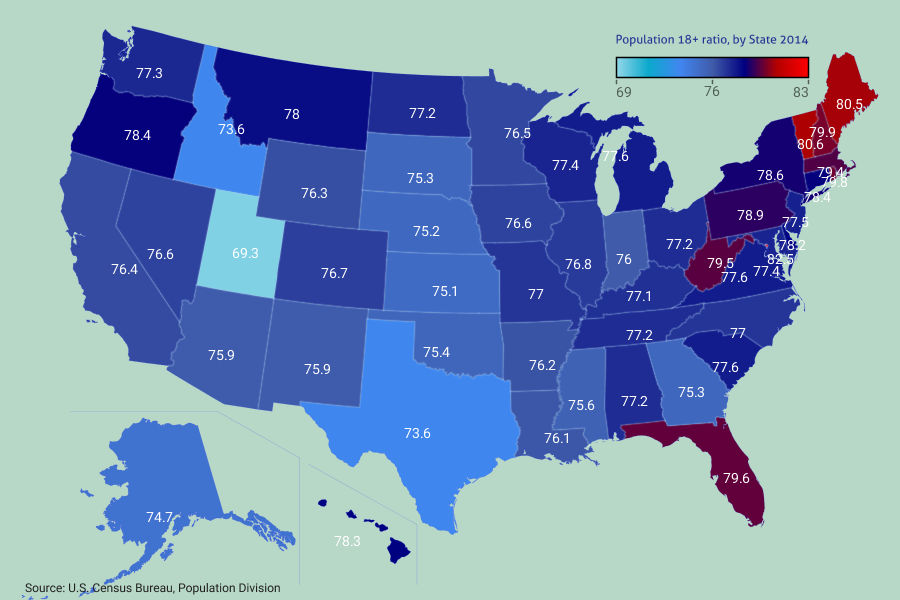
Sequential color scheme is used to accurately display the data and relationships between administrative units, also known as Heat maps.