Density maps and Dot maps
Density maps are used to visualize data on a map using color coded areas, to display the concentration or the spatial distribution of the associated data.
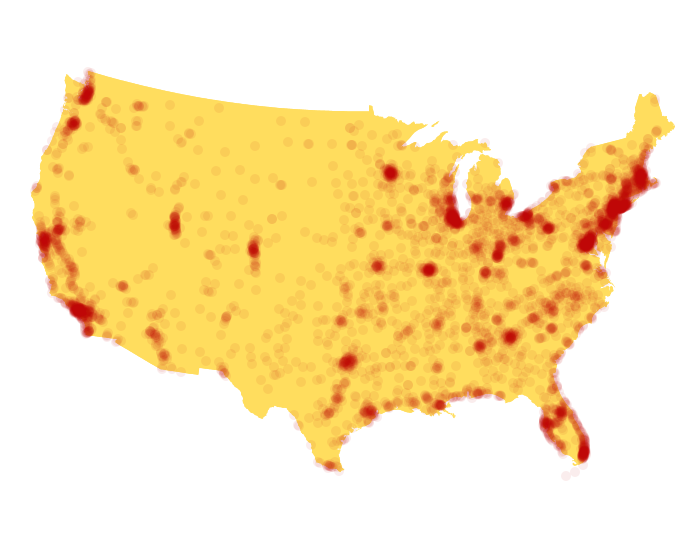
Map Grafica editor allows users o create density maps by plotting of points using a dot, or symbol whose size is small and color has a high transparency level.
The visual effect is obtained by overlapping points or dots. The areas where many points are overlapping will get a darker shade of the color used for displaying the dots.