Multiple Symbols Maps
Multiple symbols maps are used to visualize the differences in the magnitude of a discrete data set.
The symbol counts are proportional to the values of the attribute being mapped.
The symbol counts are proportional to the values of the attribute being mapped.
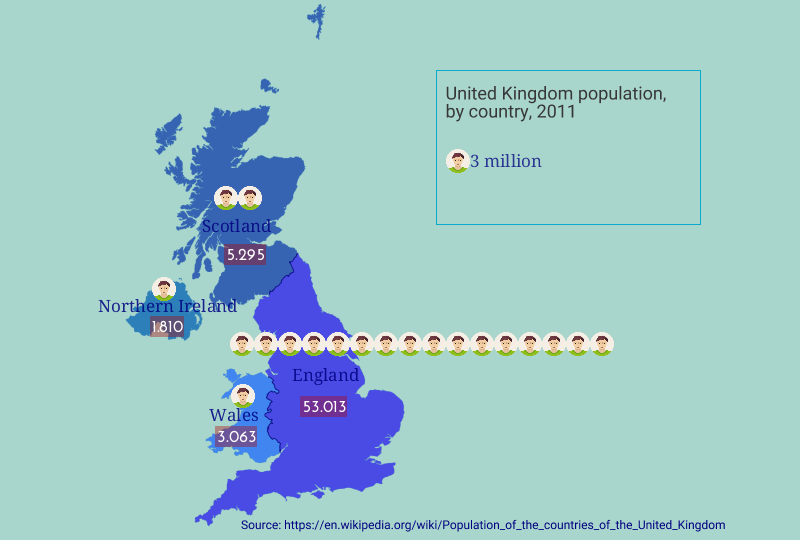
The same data can be visualized on a map using symbols with proportional size to the values of the attribute being mapped.
Map Grafica editor allows users to represent data using symbols, charts and colors.
It is the map maker choice to use the appropriate representation, so that map readers would correctly estimate values from symbols.
Map Grafica editor allows users to represent data using symbols, charts and colors.
It is the map maker choice to use the appropriate representation, so that map readers would correctly estimate values from symbols.